
What do we need to improve our business processes? The data about the past and current deals to analyze them.
Where can we get data?
With Friday CRM, you can get these details in the dashboard. Here in the list there are four options: Pipeline, Sources, Deals in progress and Sources of winning Deals.
Pipeline
In ‘Pipeline’ you can see the chart of your funnels. Above each funnel you can see the total amount of money and the number of deals. The table of the pipeline is easy to understand.
Do you want to know how many deals are at each stage?
Piece of cake. Clicking on any stage of the funnel and the directory with them opens in the new page.
Would you like to know how many deals your manager won last month?
At the top in the drop-down menu choose a manager, then dates. You get the results right away.
Do you want to find out which lead source has brought the largest number of leads?
Easy. Go to the sources tab. Here you can see the average size of the deal won, deals that are won, lost and ones in progress and total amount.
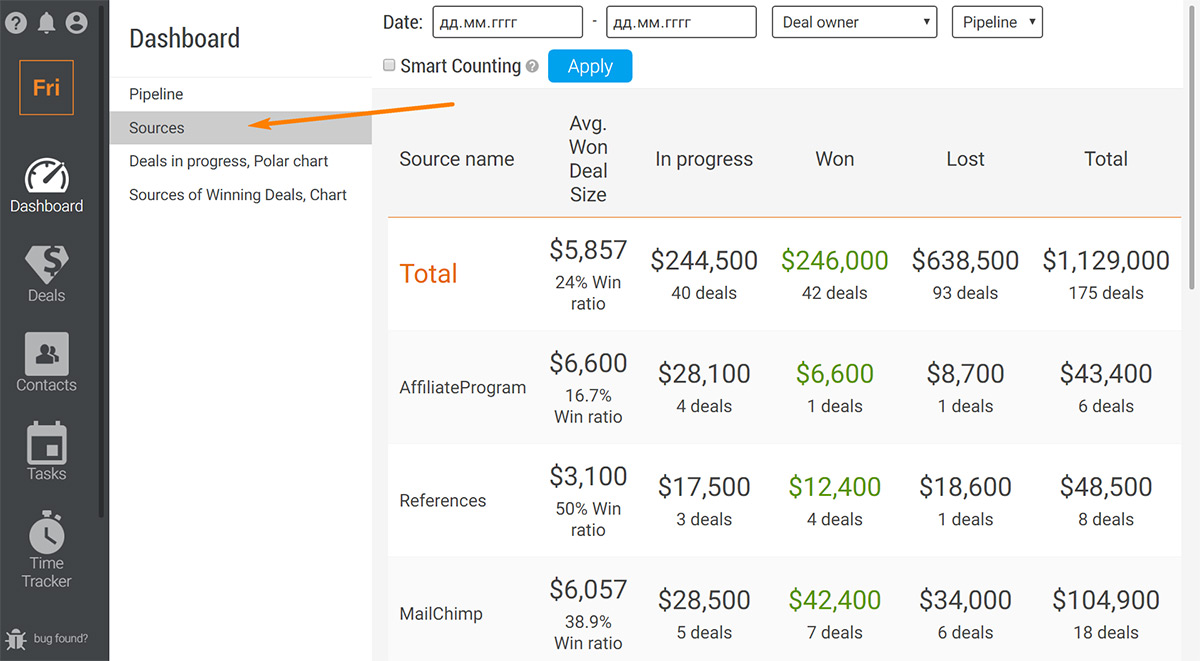
Looking at this table we can come to the conclusion which source has brought the most money.
What else do we see in the dashboard?
The chart of all deals at every stage during the whole time and the chart of the sources that has brought in the successful deals. You can get the results for any period of time: two months, half a year and year.
Hundreds of people working in design companies or architecture firms are already using Friday CRM to monitor their deals and analyze the data. Join them and you will get all your deals in the right order.